
The word analytics will make some people cringe. For me, it makes me smile and sometimes laugh. I find hours will go by as I dig in and find treasures of unexpected information with each click. Okay, I guess I have a geek side to me.
When I talk with my clients about Google Analytics many times they will tell me that they have set it up but they don’t really look much or at all. My goal over the next several months is to break it down into easy implement steps so you can have a better understanding of how you can pull meaningful information that will save time, money, and help you to know what is working for you and your business.
Notate Your Timeline:
If there is only one thing you do right now…
One of the easiest things you can do, even if you aren’t ready to start diving into the numbers, is to find your timeline and start noting it. By doing this you will begin to capture the history of when you launch specific marketing campaigns, sales, have a booth at a trade show, etc. What you note should include both online and offline activity as you should see an impact from each in your analytics.
Why note offline? Think about the last time you saw a magazine ad, or a mailer to your home that interested you. Perhaps you attended an event and picked up a pamphlet from a company that offered services you were considering. What did you do next? Did you immediately call the company or walk in their door? Or, did you go to their website first to do a little research. Offline will have an impact on your web traffic too, so it is important to capture.
Even if you don’t know how to read your analytics yet, if you start notating now, by the time you have a better understanding of GA or hire someone to do it for you, you will have better insights to compare right away and can make informed decisions on what does and doesn’t work for you.
How to Notate Your Timeline:
Four simple steps …
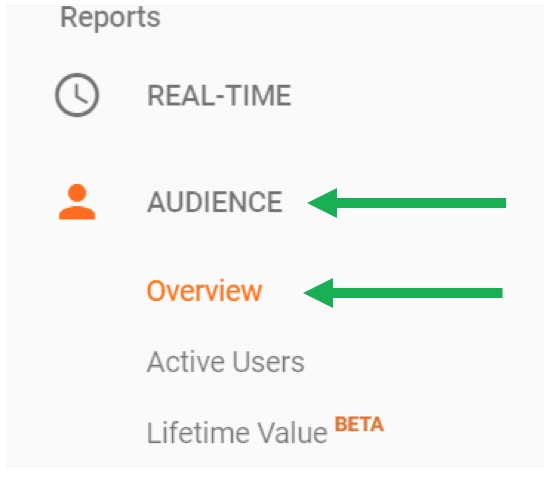
1 – Once you sign in to GA, you will see links along the left side. You can find your timeline in many areas, here is clicked on Audience and then Overview.
Your timeline will be at the top of the page. I changed my dates at the top so I could see month over month which shows two lines in my timeline. The blue one being this month, the orange last month.
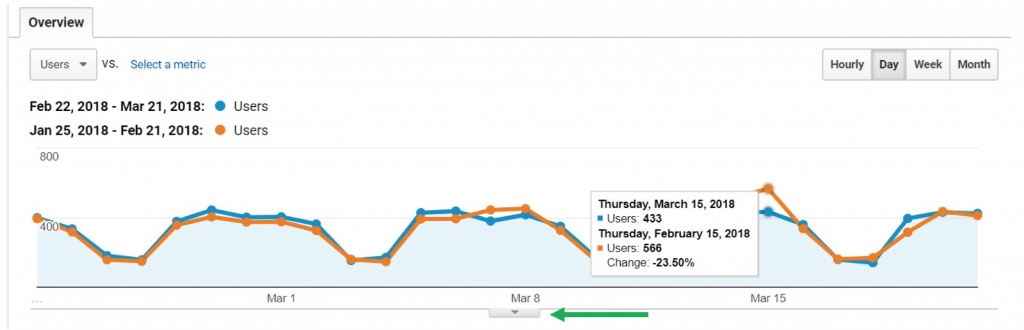
2 – Click on the arrow at the bottom of the timeline and this will open the box for you to put in your notation.

3 – Click Create new annotation
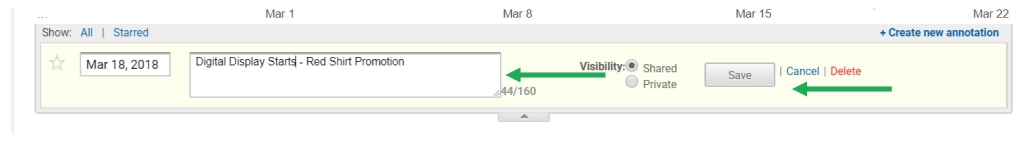
4 – A form will drop down where you can name what you did (ex. Digital Display) and what you promoted (ex. Red Shirts). Click Save.
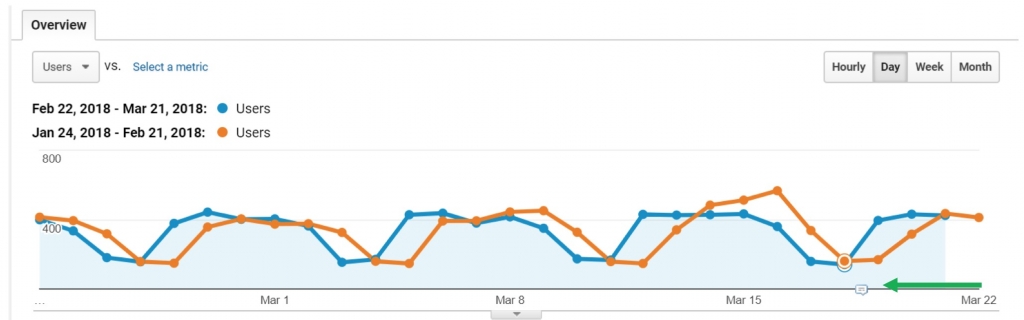
You will then see a notation bubble on the dateline of your timeline. You can double click this to open and see what you did on that day. When you start comparing MOM and YOY, the increases or decreases you see should have more meaning.
One more thing when considering what to notate are industry events. Perhaps a big article came out related to what you do or sell. Or, maybe you heard there was an algorithm change in how websites will be ranked. Happenings that could have an impact on your web traffic are good to notate so as time goes by, you can have a more in-depth understanding as to why your numbers have fluctuated.
If you haven’t taken the time to get into GA, it can be intimidating. The good news is, you can’t break it, so go ahead, find some fun and play with it a bit. You never know what you are going to uncover!